hist(x, ...)14 Base R plots
1 Histogram
The function
hist()is used to obtain a histogram of a quantitative variableSyntax of
hist()xis a quantitative vector
hist(x = penguins$body_mass_g)![]()
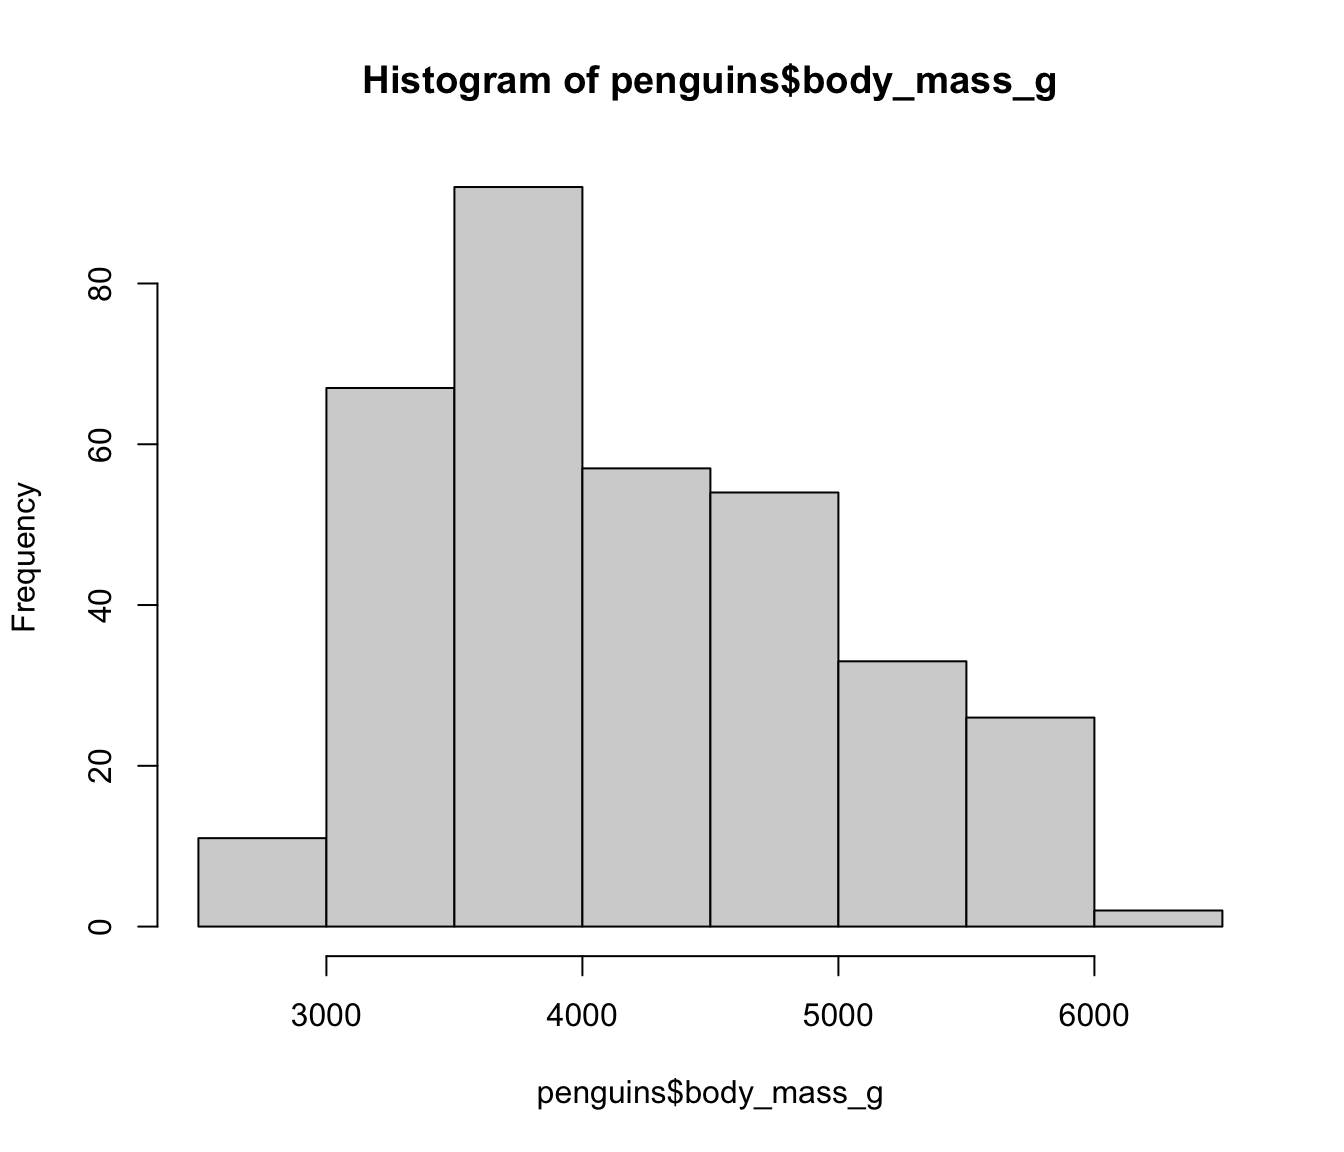
- Some useful arguments of
hist():xlab,main,probability, etc.
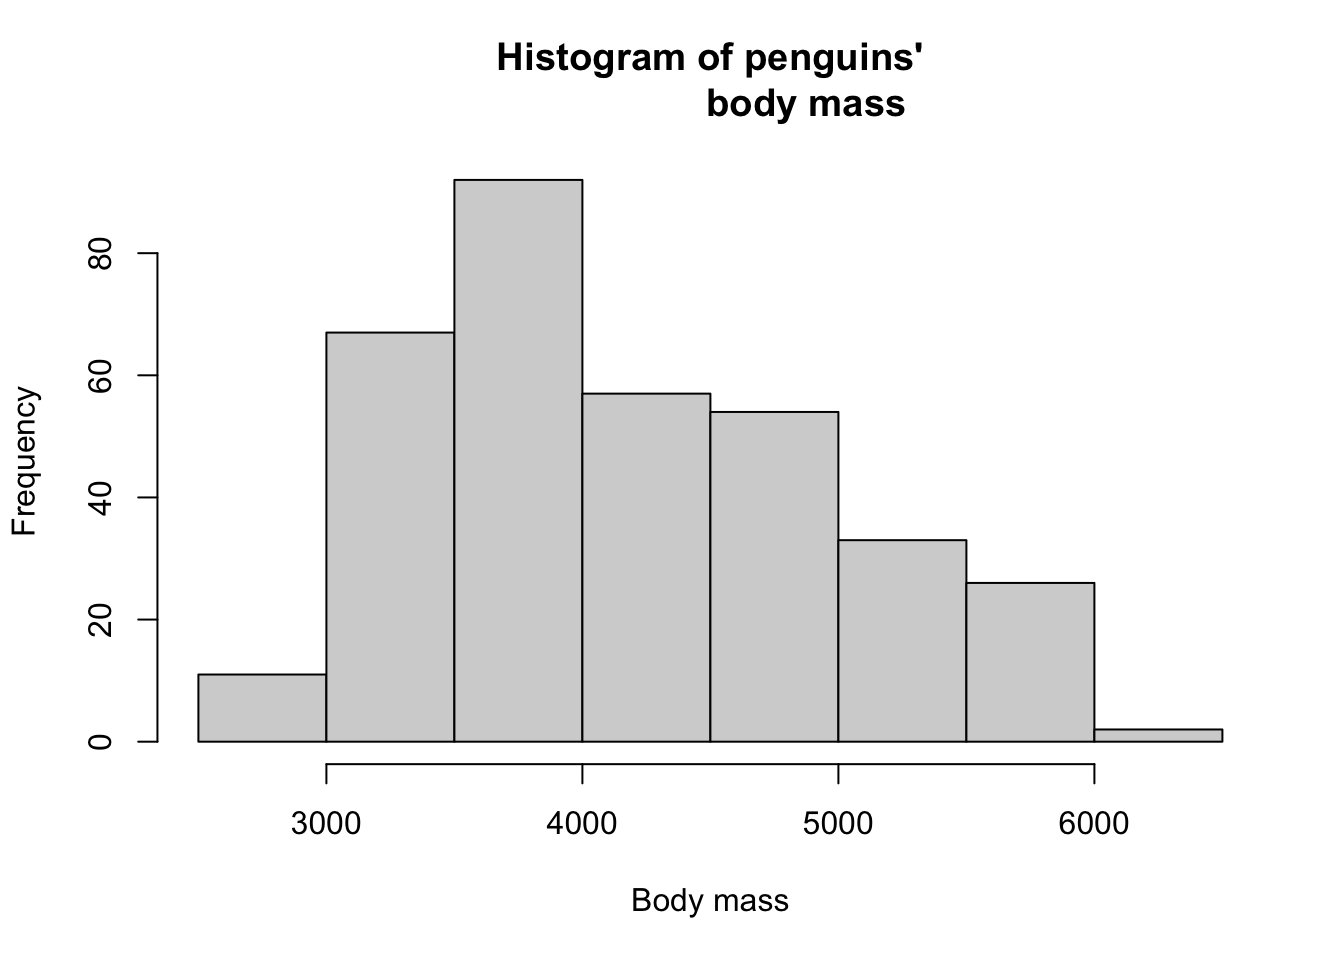
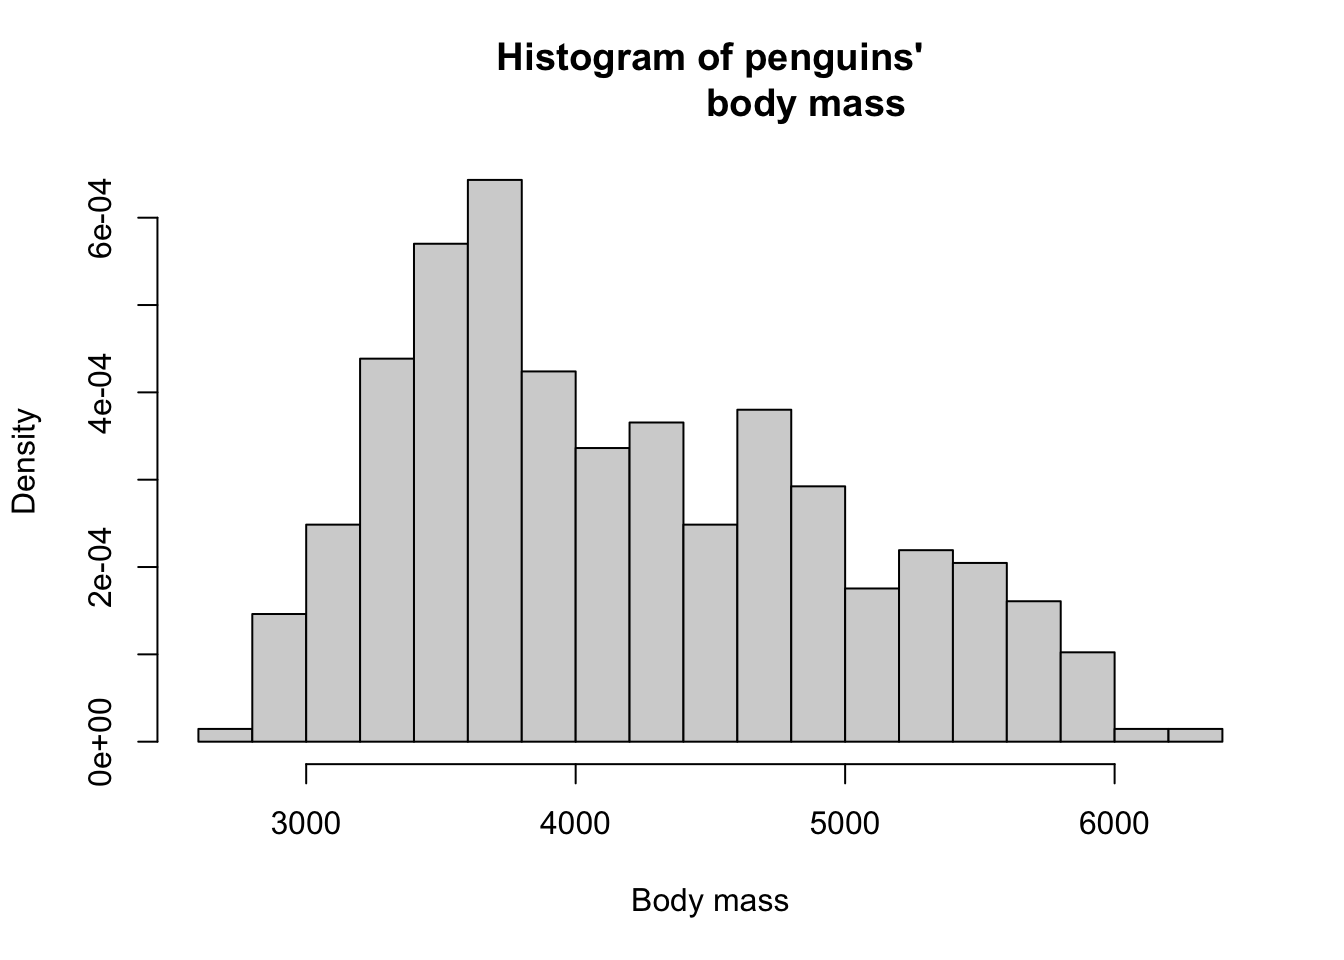
hist(
  x = penguins$body_mass_g,
  xlab = "Body mass",
  main = "Histogram of penguins'
                  body mass"
  )
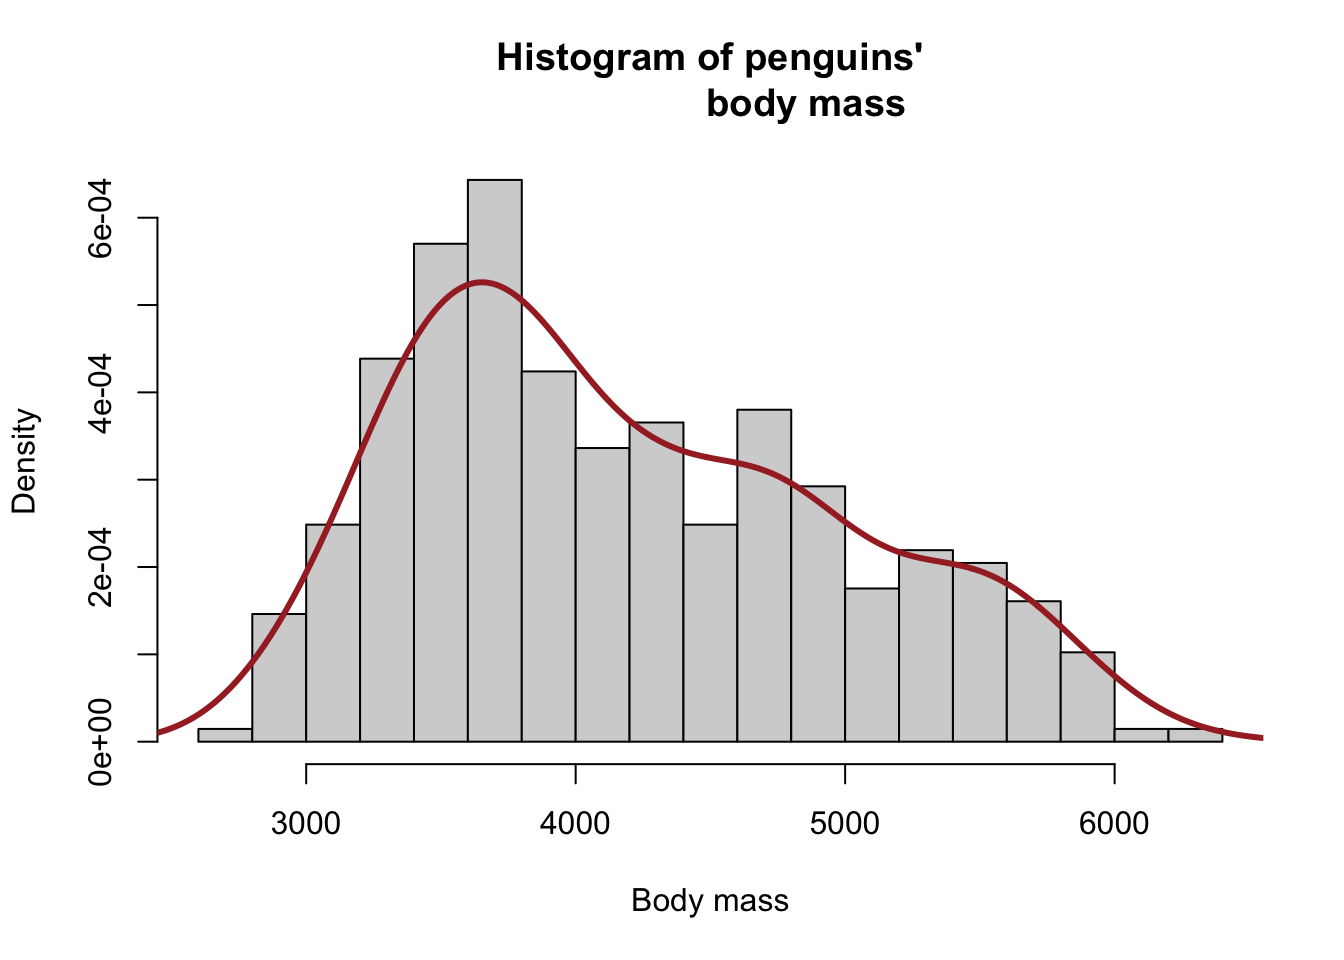
hist(
  x = penguins$body_mass_g,
  xlab = "Body mass",
  main = "Histogram of penguins'
                  body mass",
  breaks = 20,
  probability = T
  )
hist(
  x = penguins$body_mass_g,
  xlab = "Body mass",
  main = "Histogram of penguins'
                  body mass",
  breaks = 20,
  probability = T
  )
#
lines(
  density(x = penguins$body_mass_g,
          na.rm = T),
  lwd = 3, col = "brown"
  )
boxplot(x = penguins$body_mass_g)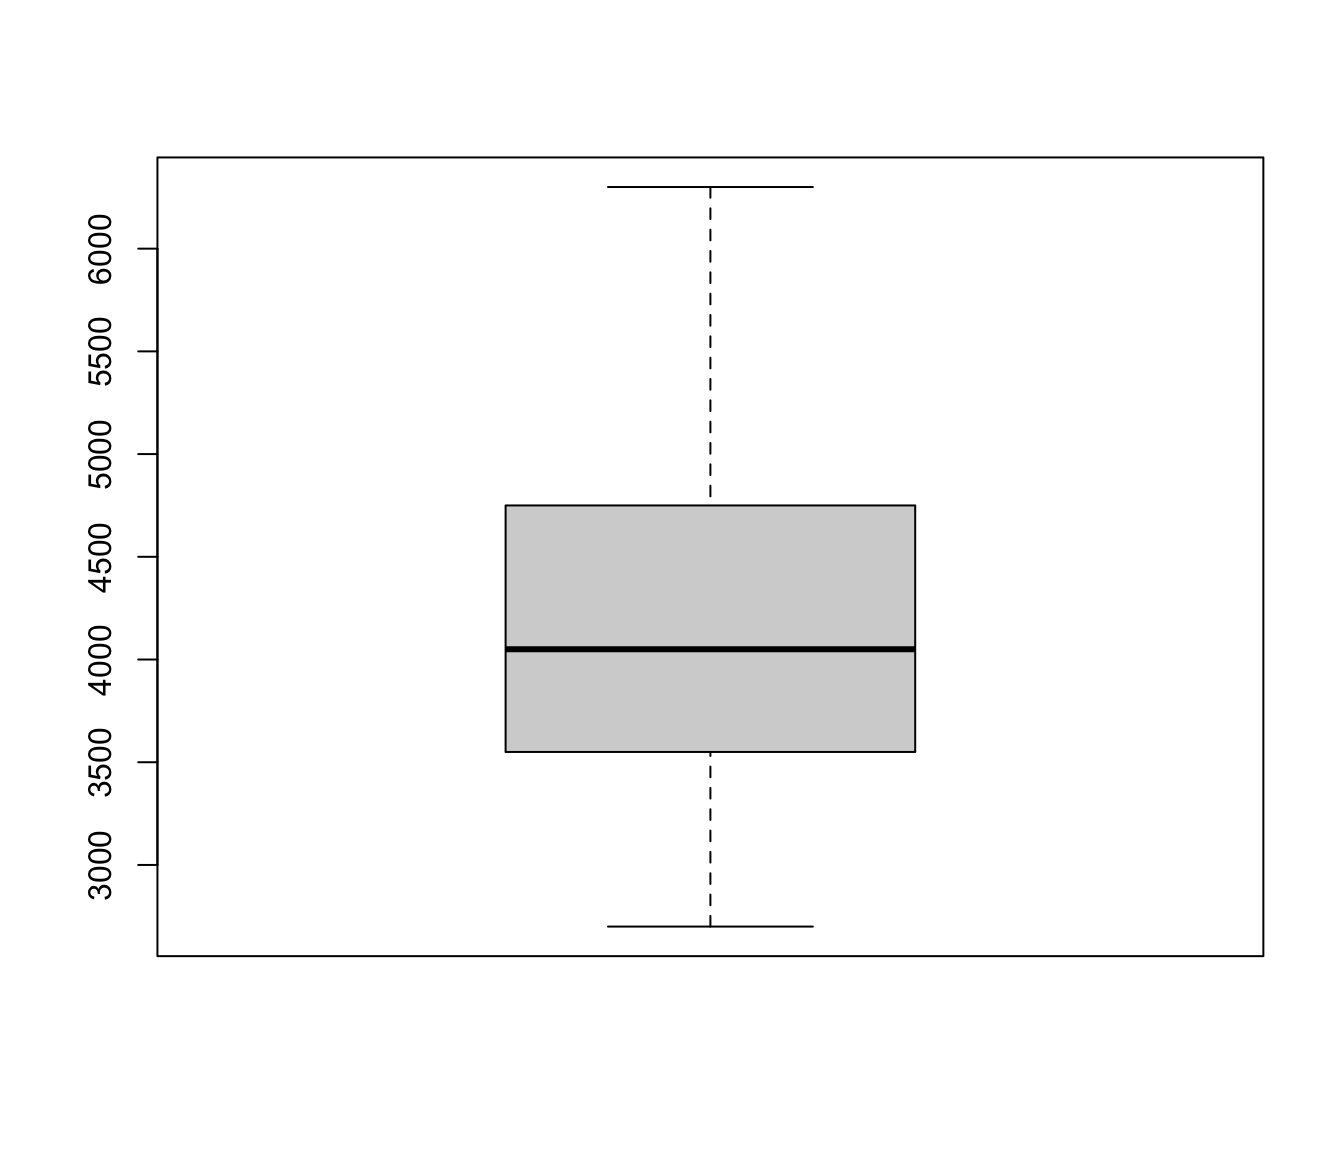
boxplot(formula = body_mass_g ~ species,
        data = penguins)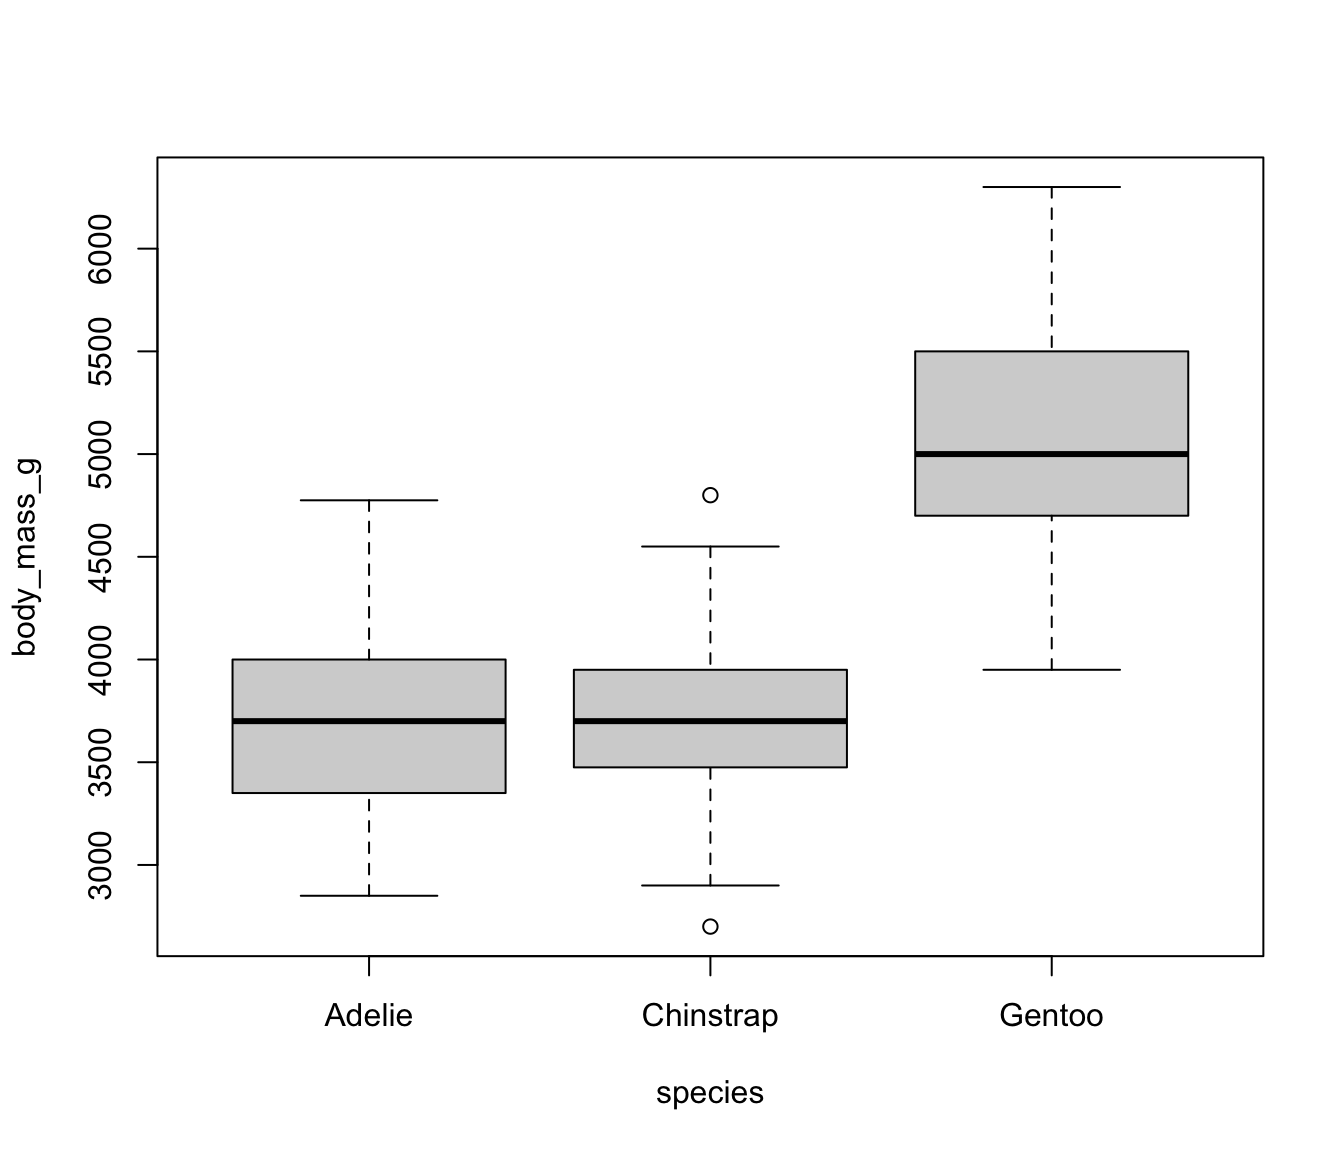
#
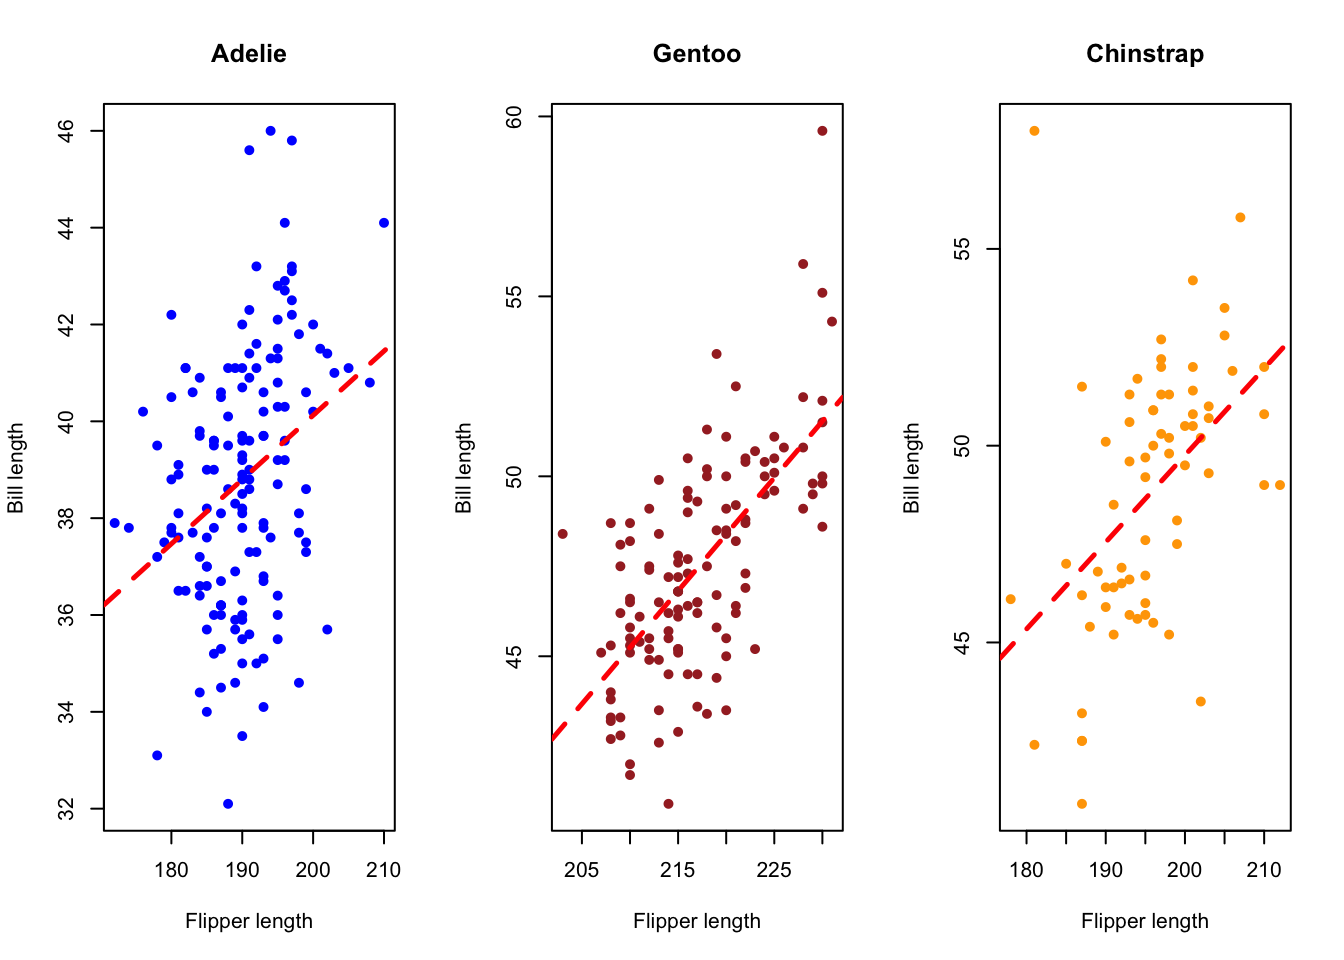
plot(x = penguins$bill_length_mm,
y = penguins$flipper_length_mm)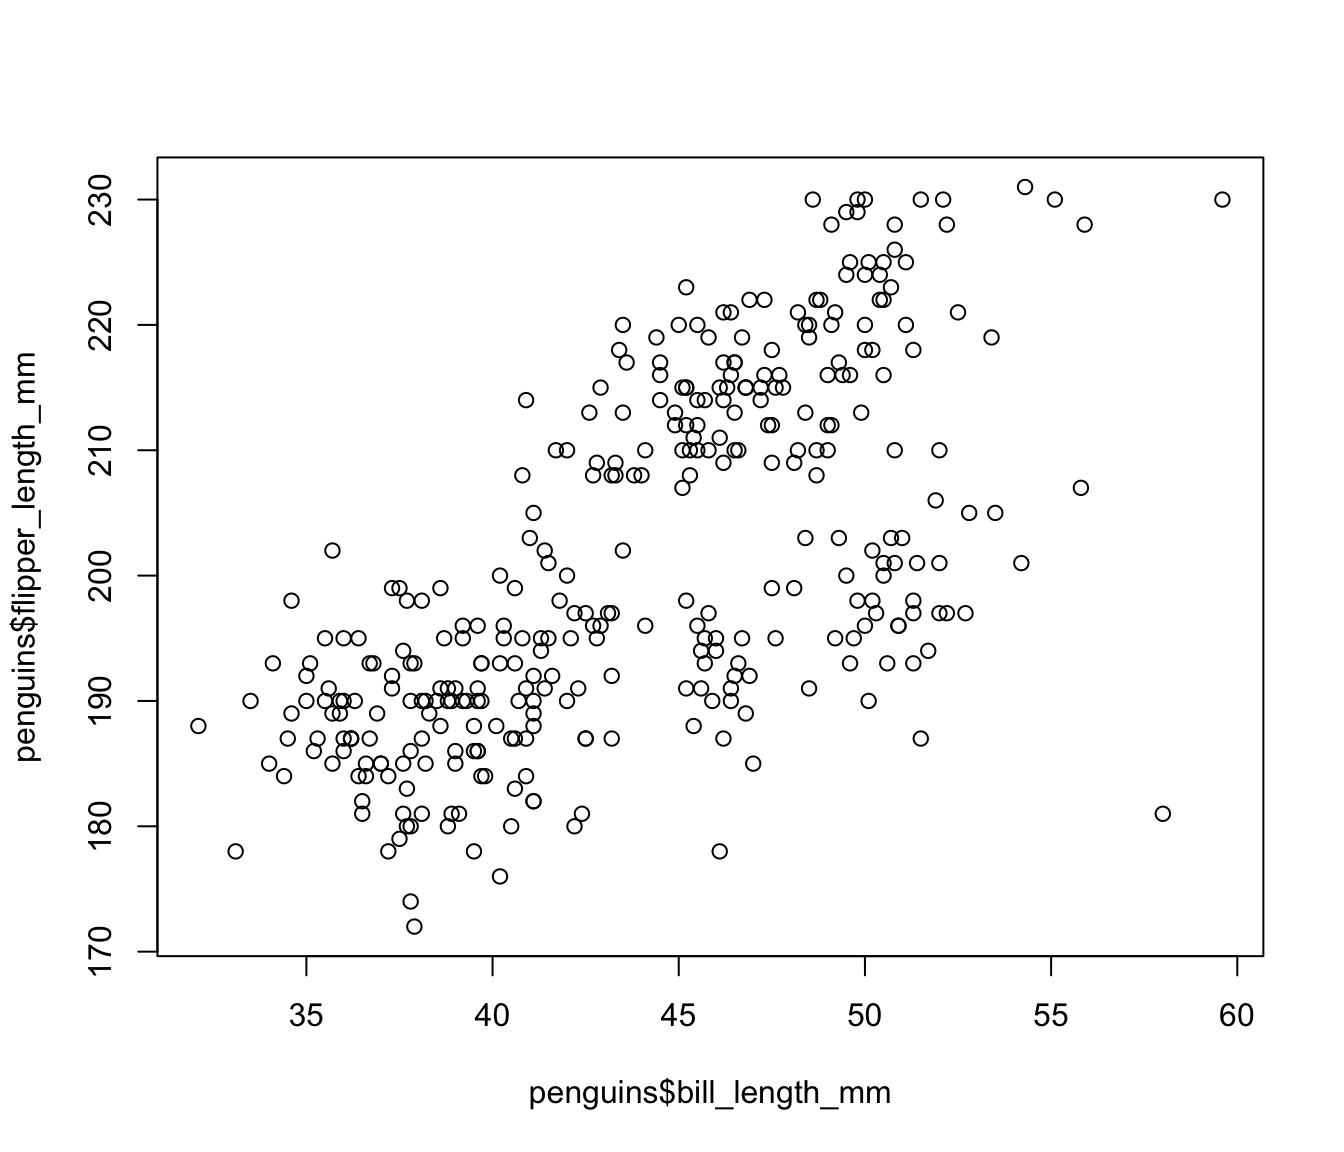
plot(x = penguins$bill_length_mm,
     y = penguins$flipper_length_mm,
xlab = "Flipper length") 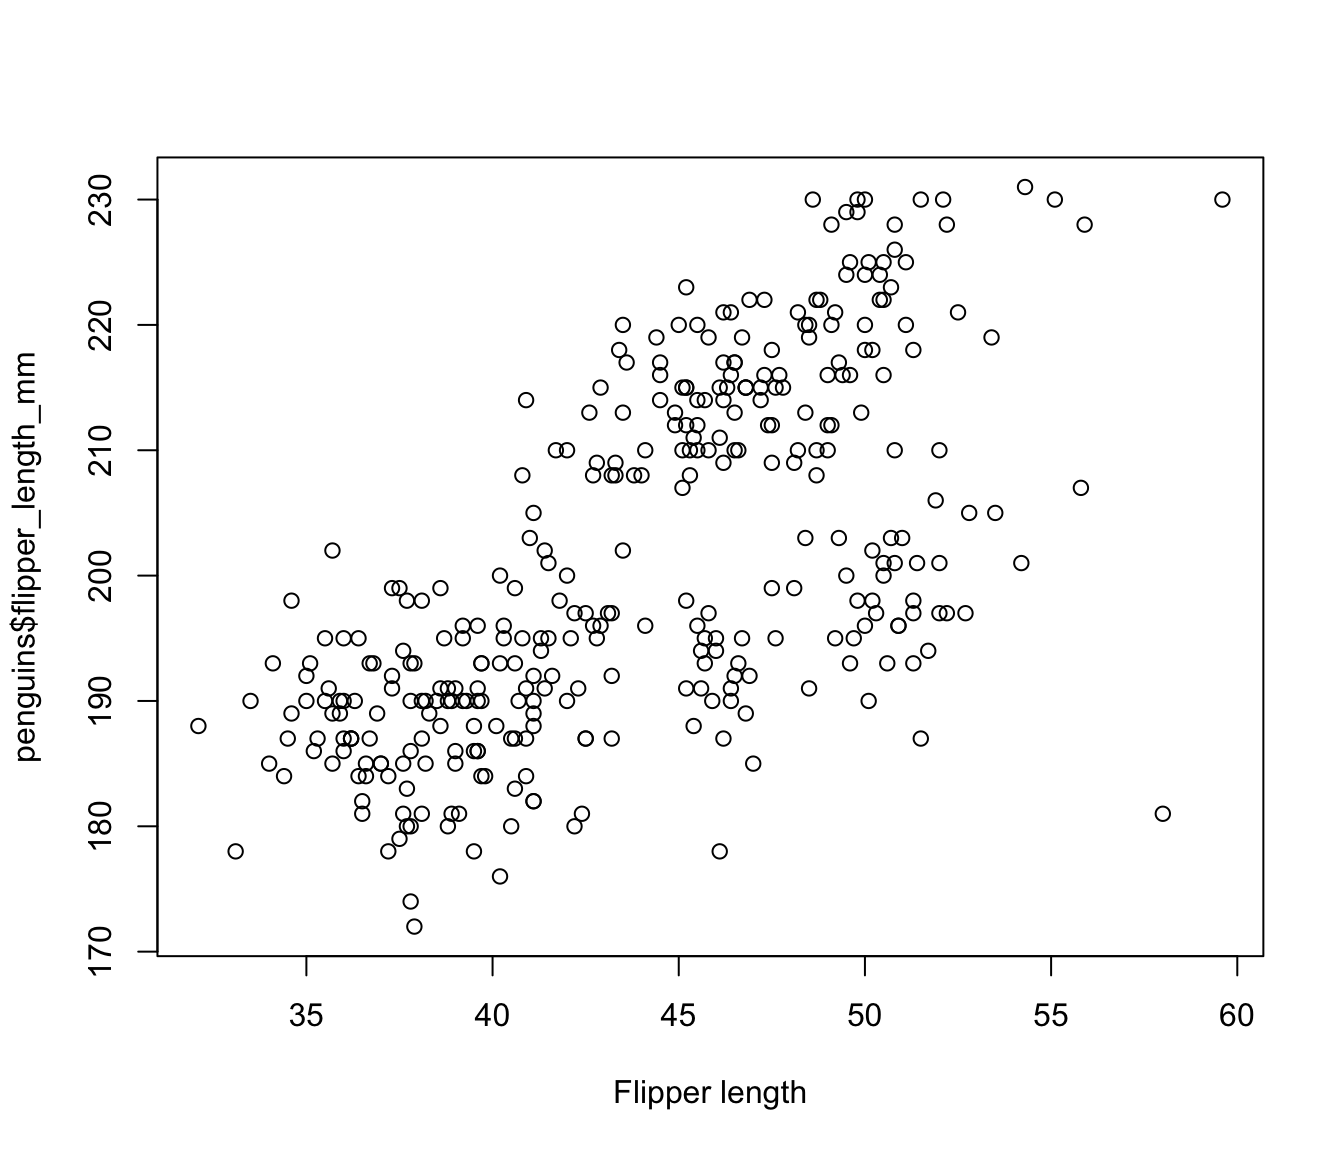
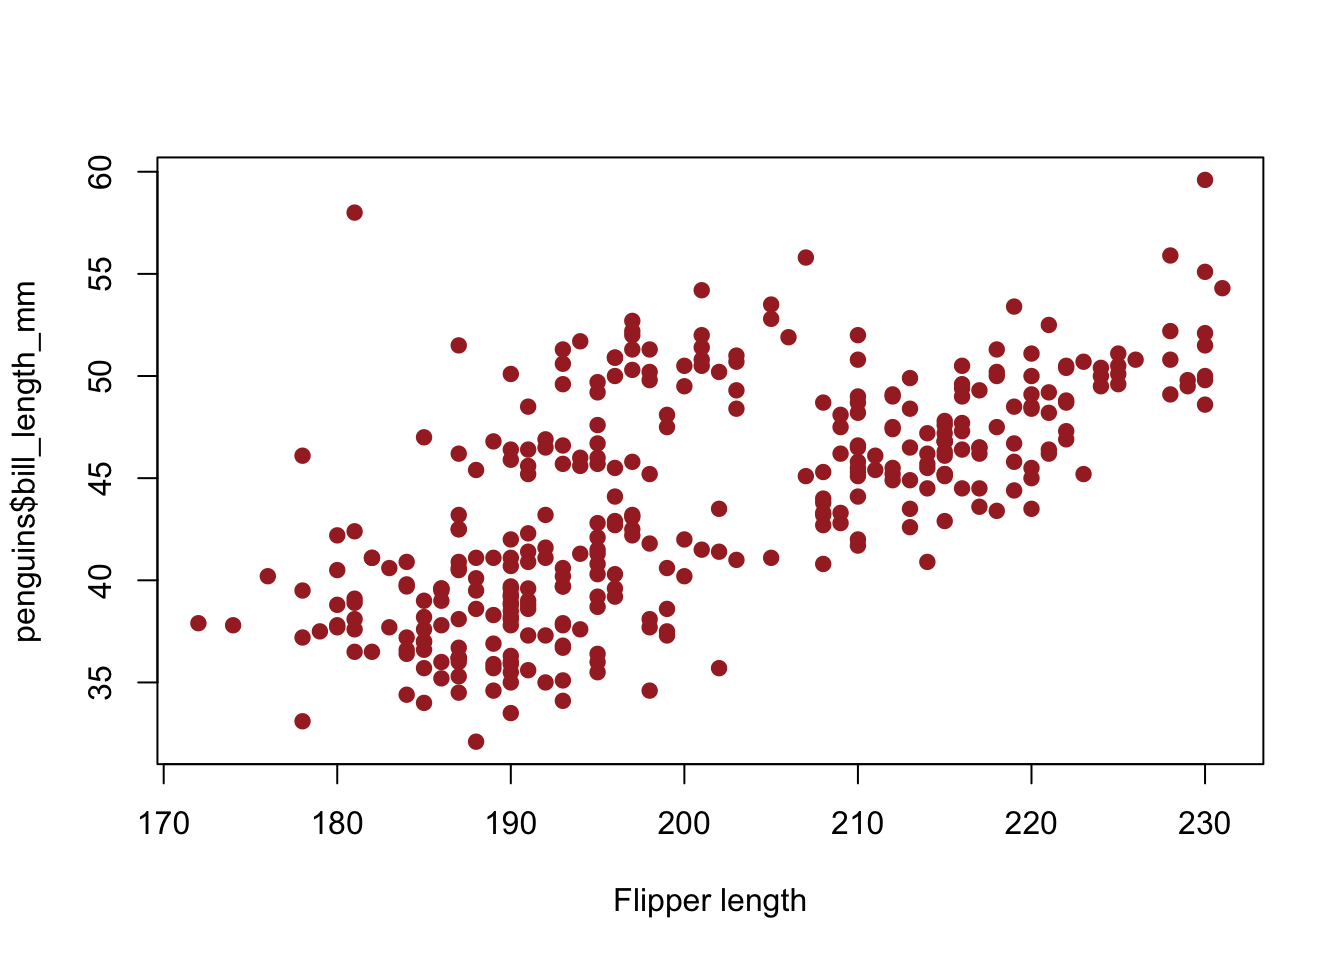
plot(
  x = penguins$flipper_length_mm,
  y = penguins$bill_length_mm,
  xlab = "Flipper length",
  pch = 20,
  cex = 1.5,
  col = "brown"
  )
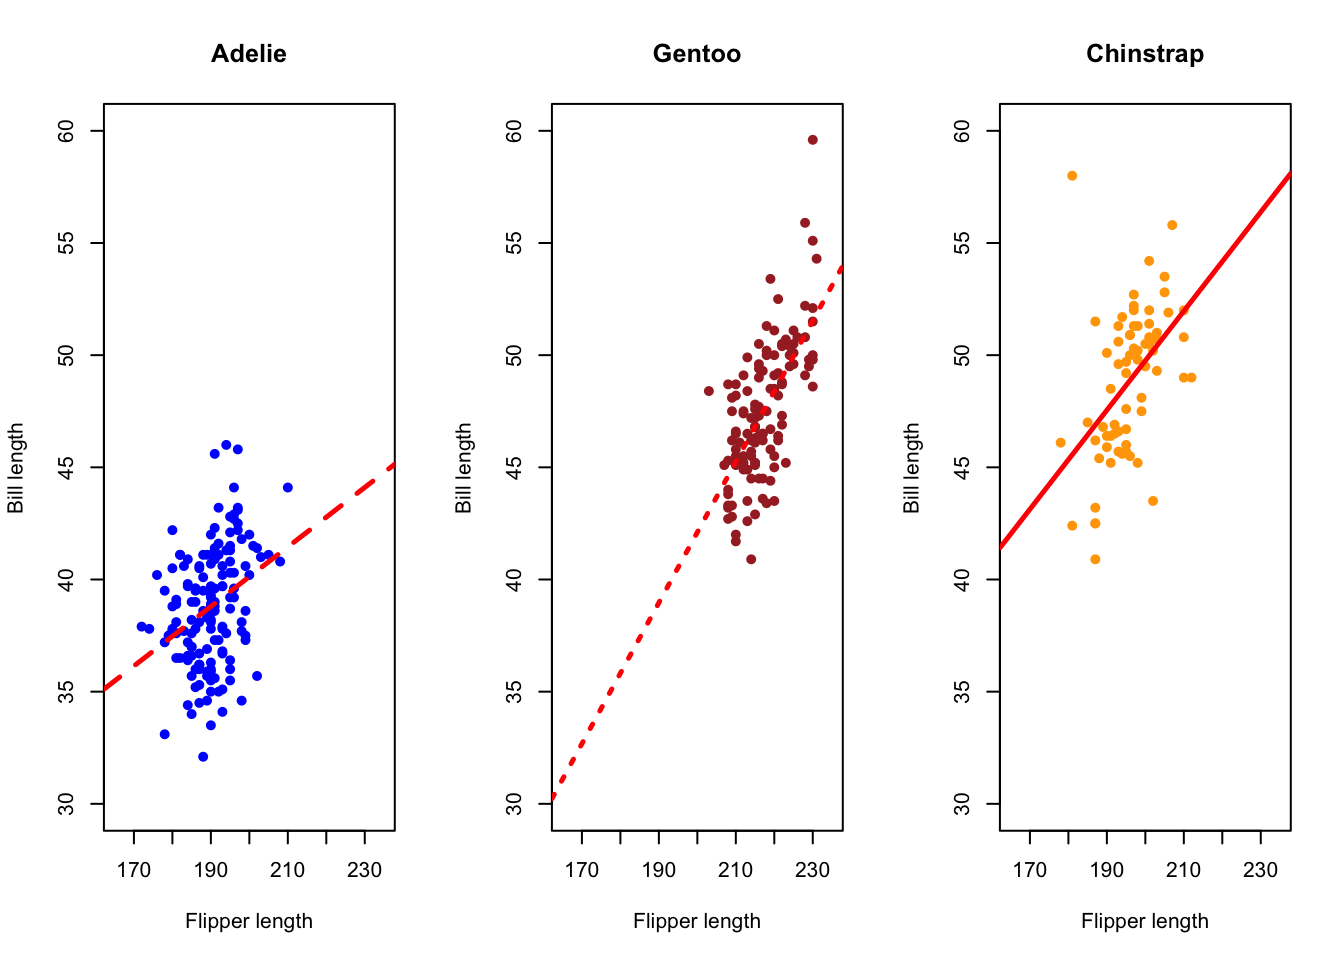
Scatter plot with a linear model fit
plot(
  x = penguins$flipper_length_mm,
  y = penguins$bill_length_mm,
  xlab = "Flipper length",
  pch = 20,
  cex = 1.5,
  col = "brown")
#
mod1 <- lm(bill_length_mm ~ flipper_length_mm,
     data = penguins)
#
abline(mod1, col = "blue", lwd = 4)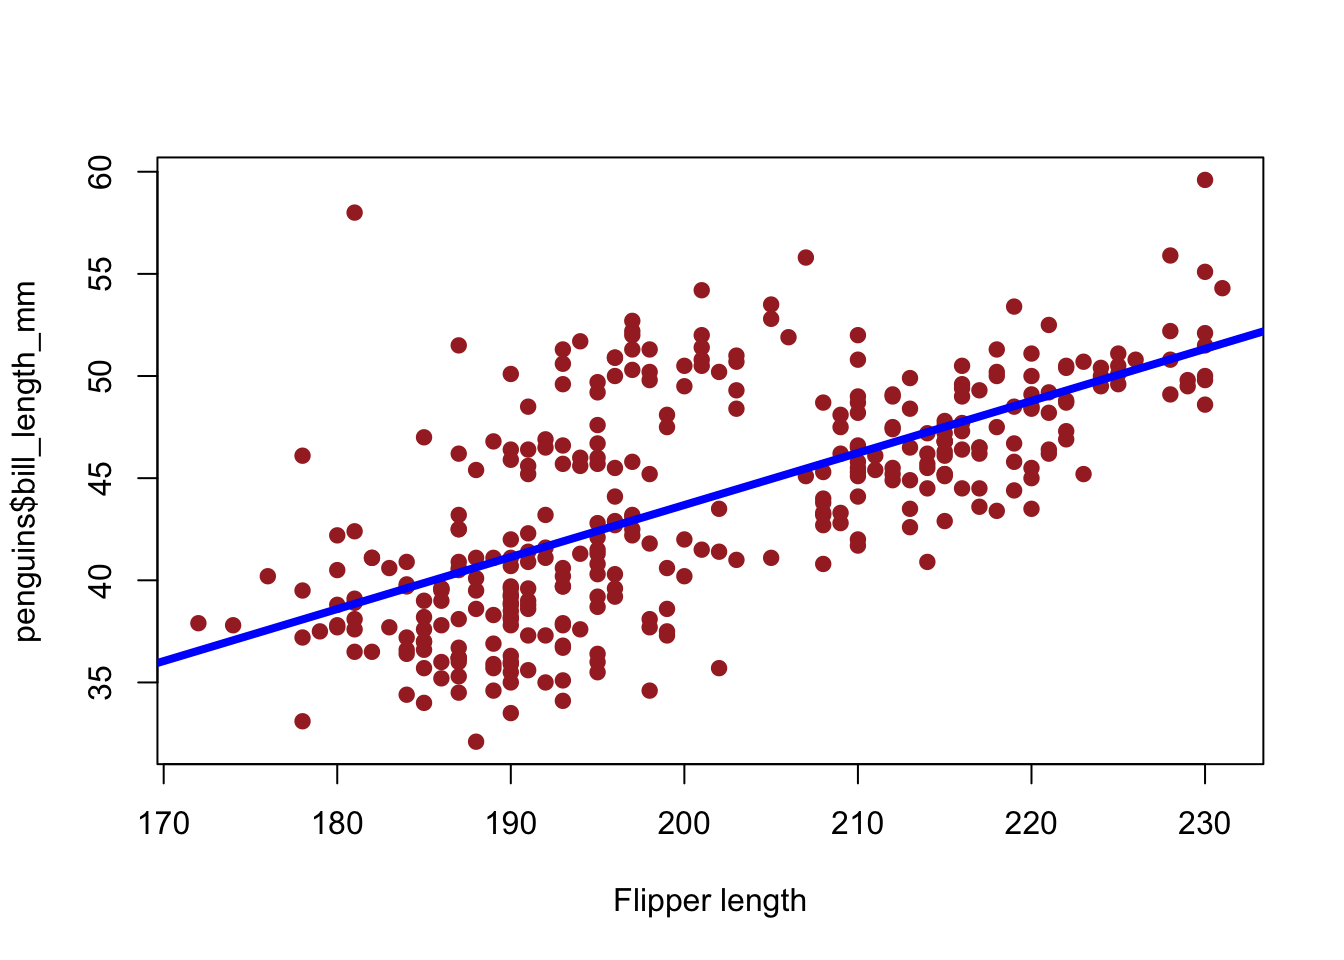
lm()is for fitting a linear model
Frequency distribution of species
table(penguins$species)#>
#> Adelie Chinstrap Gentoo
#> 152 68 124barplot(height = table(penguins$species))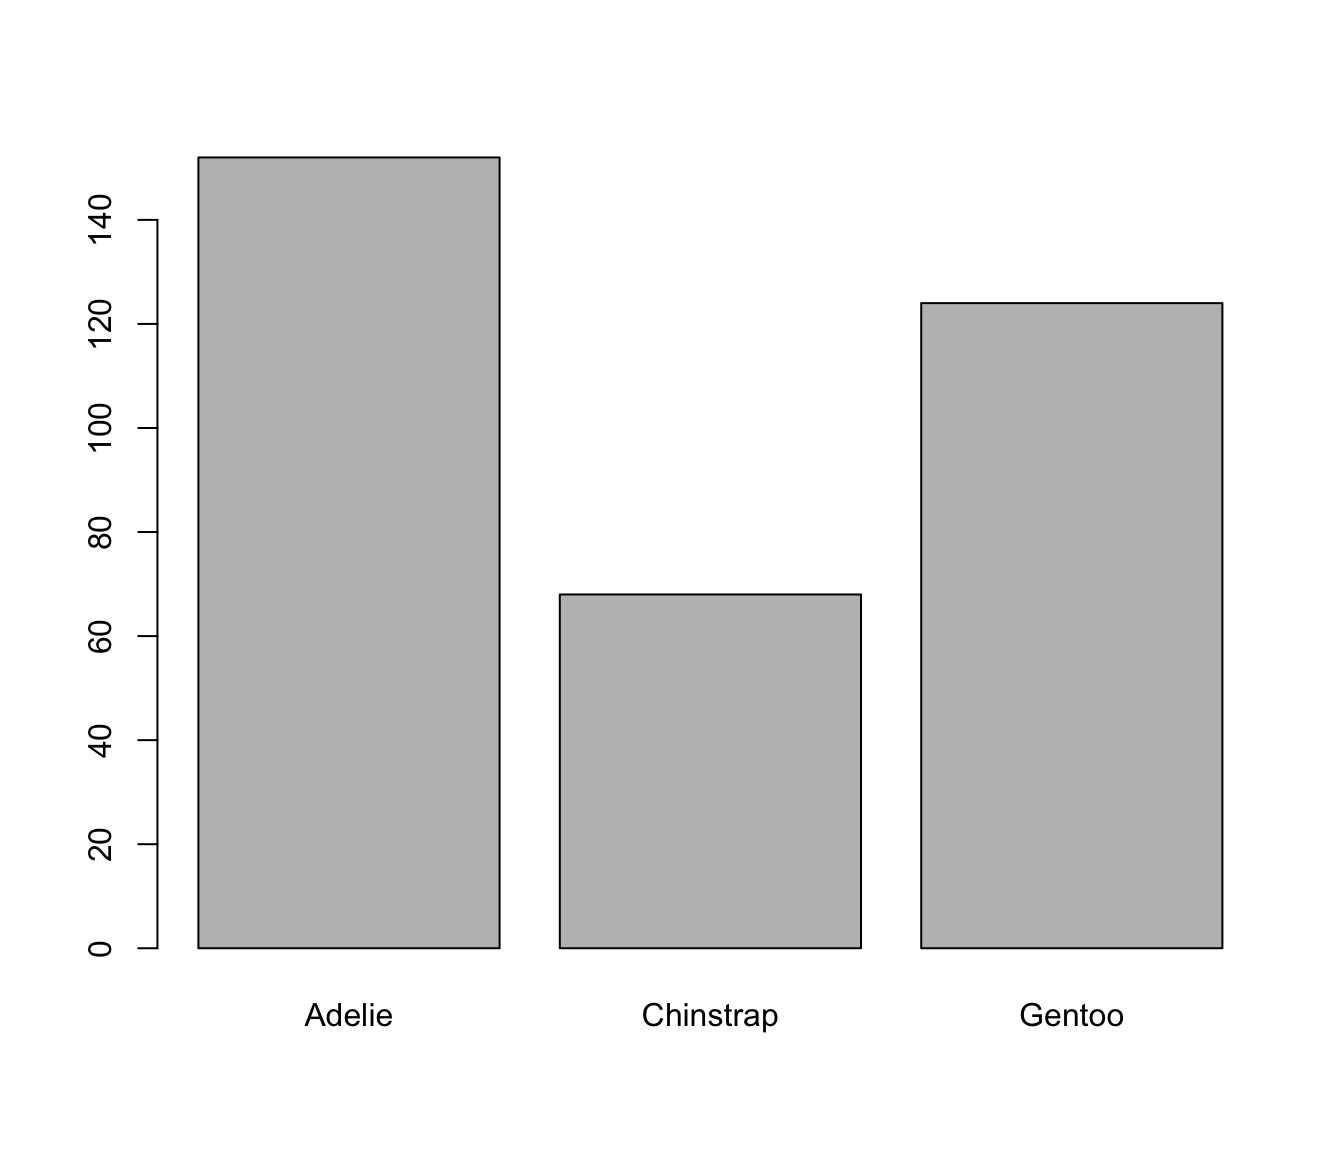
Distribution of bill_length_mm at different levels of species
par(mfrow = c(1, 3))
hist(x = penguins$bill_length_mm[penguins$species == "Adelie"])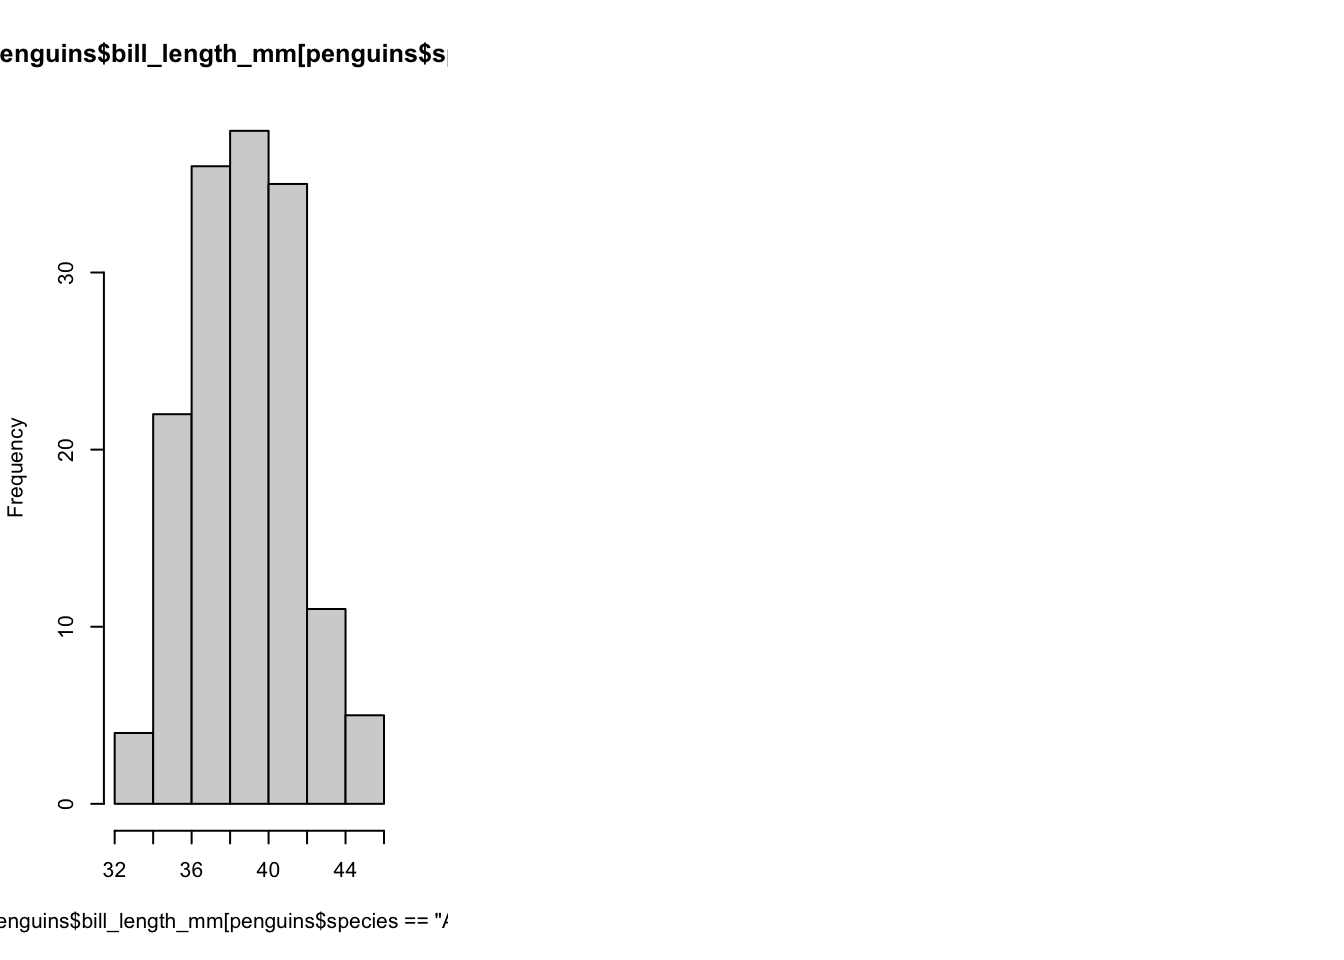
par(mfrow = c(1, 3))
hist(x = penguins$bill_length_mm[penguins$species == "Adelie"])
hist(x = penguins$bill_length_mm[penguins$species == "Gentoo"])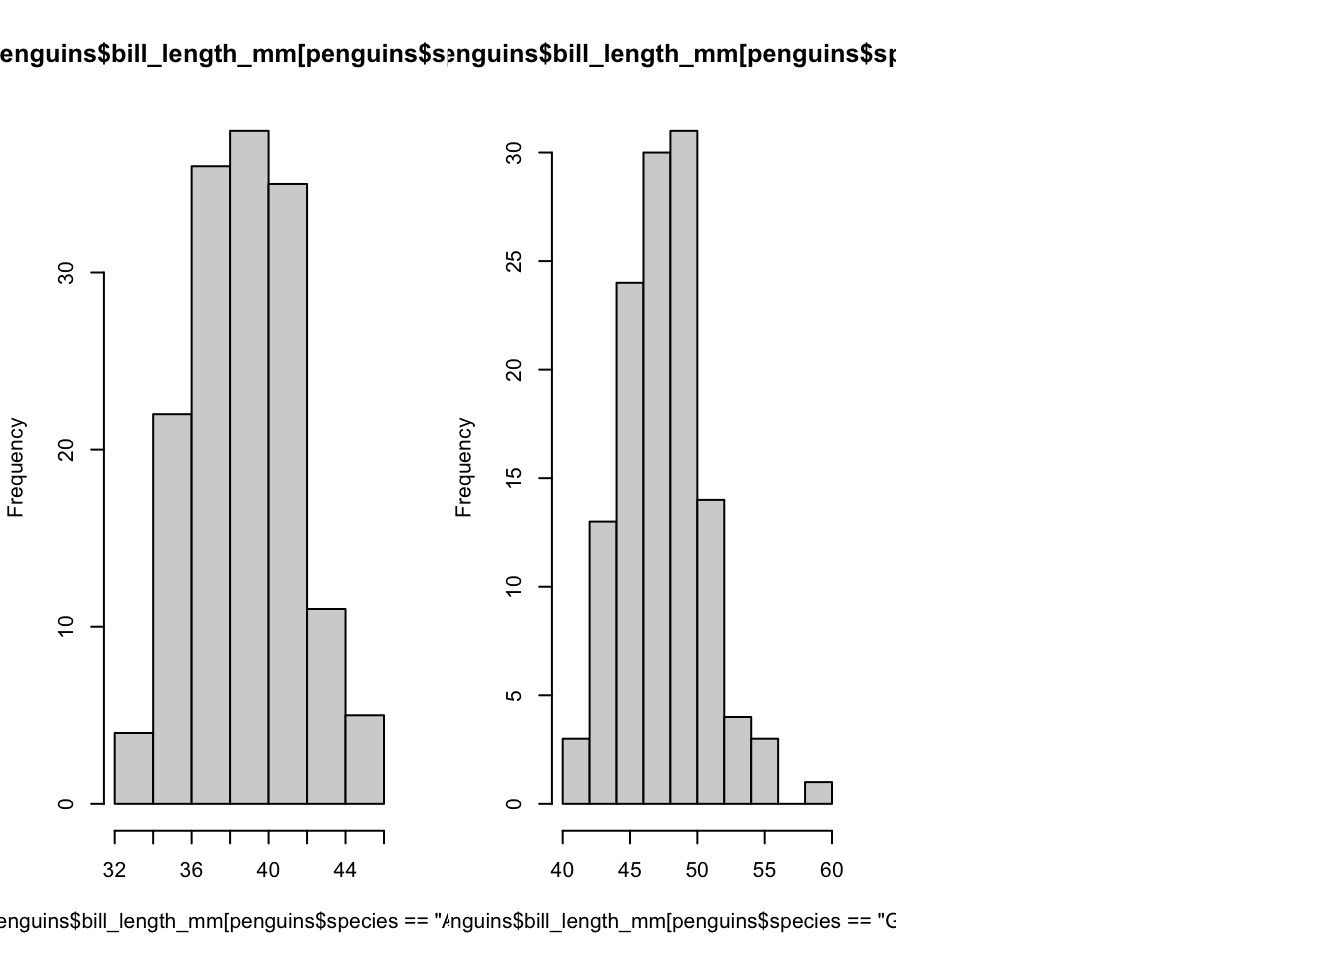
par(mfrow = c(1, 3))
hist(x = penguins$bill_length_mm[penguins$species == "Adelie"])
hist(x = penguins$bill_length_mm[penguins$species == "Gentoo"])
hist(x = penguins$bill_length_mm[penguins$species == "Chinstrap"])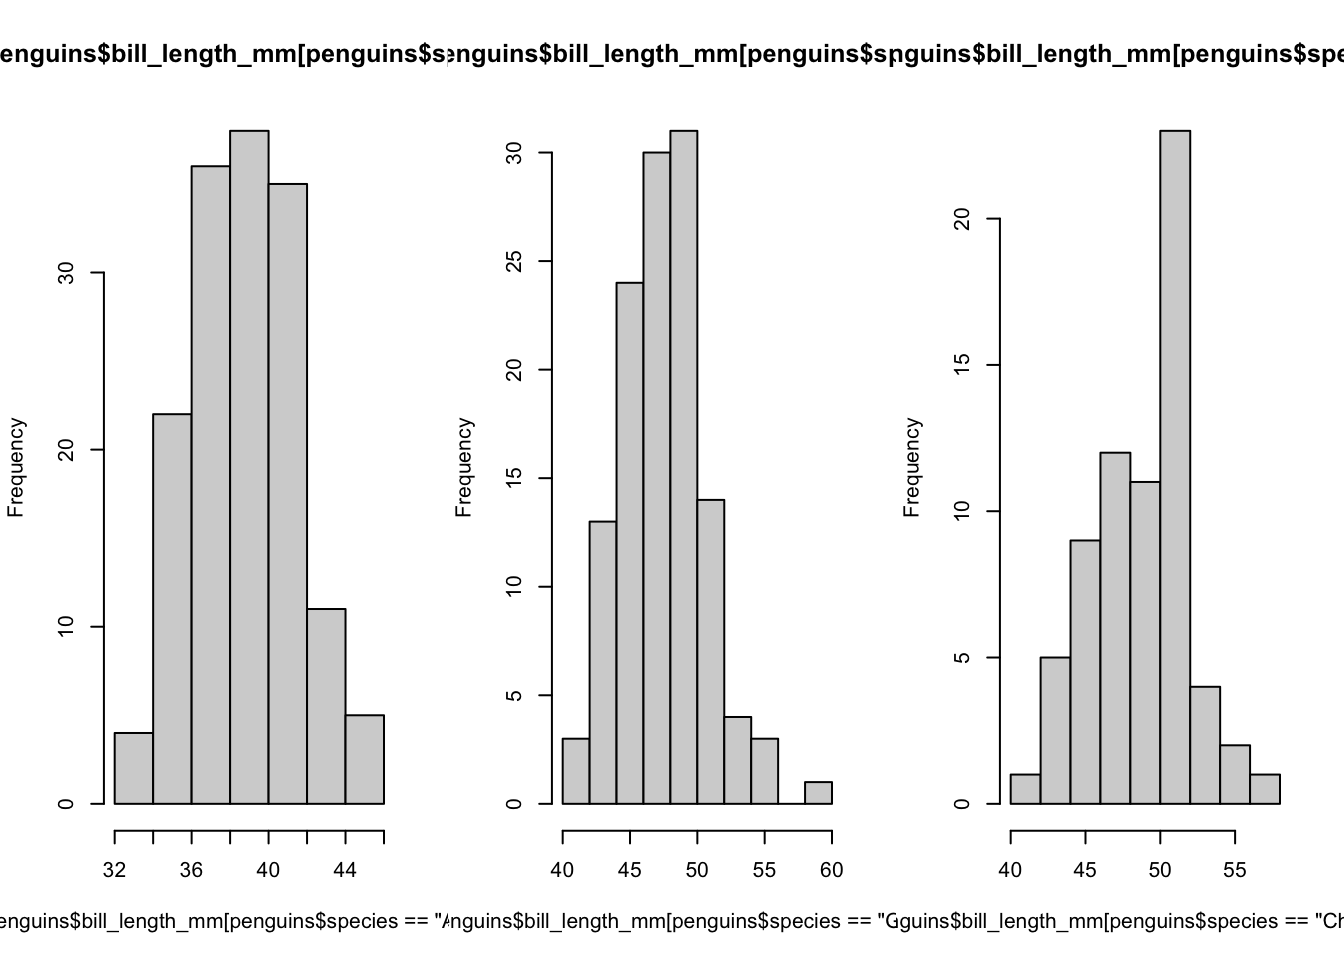
Exercise 3.1.5
- Association between bill and flipper lengths by species