10 Data Science Workflow and Importing Data
1 Data science tools
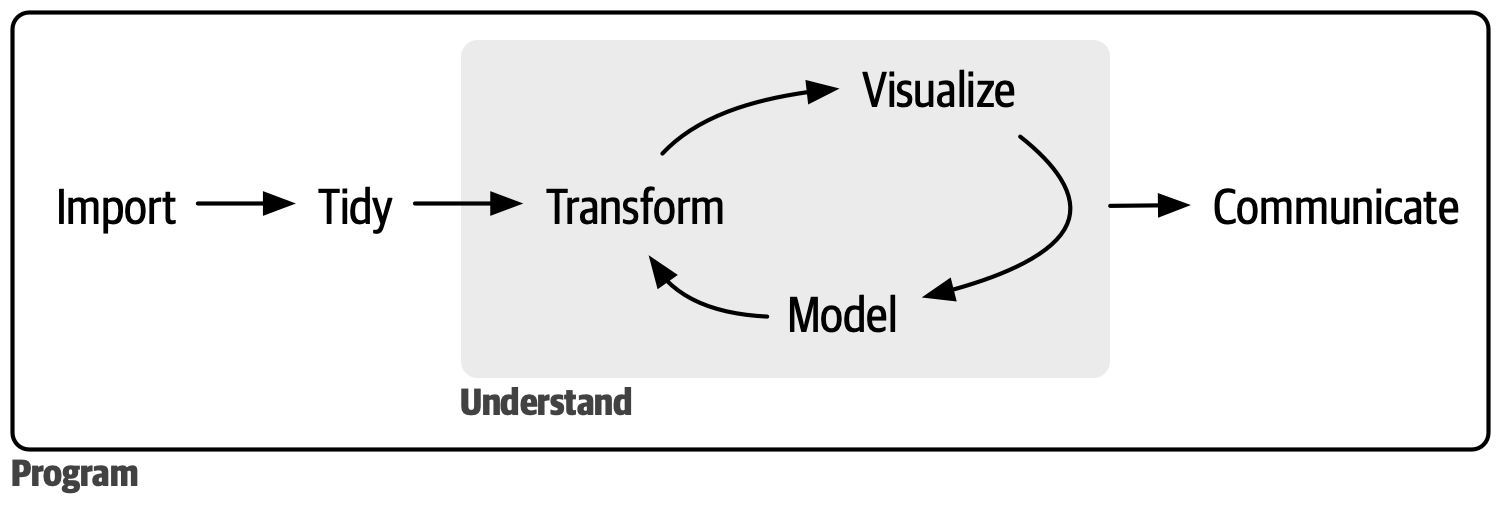
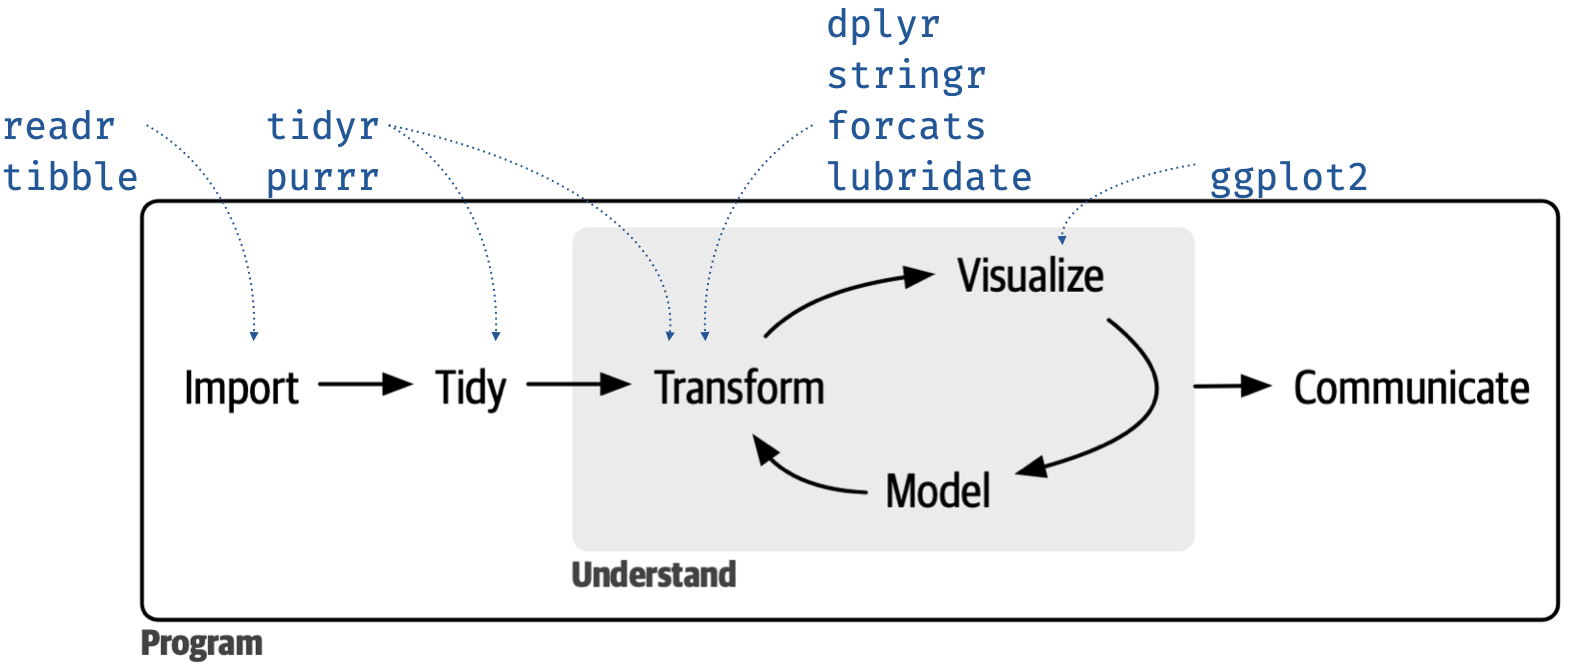
1.1 Import
- Reading data from different sources, e.g., SAS, SPSS, Stata, Excel, SQL, etc.
1.2 Tidy
- When your data is tidy, each column is a variable and each row is an observation
1.3 Transform
- Transformation includes
- narrowing in on observations of interest (like all people in one city or all data from the last year),
- creating new variables that are functions of existing variables (like computing speed from distance and time), and
- calculating a set of summary statistics (like counts or means).
Together, tidying and transforming are called wrangling because getting your data in a form that’s natural to work with often feels like a fight!
1.4 Visualize
- Visualization is a fundamentally human activity.
- A good visualization will show you things you did not expect or raise new questions about the data.
- A good visualization might also hint that you’re asking the wrong question or that you need to collect different data.
1.5 Model
- summarizing data
- Models are complementary tools to visualization.
- Once you have made your questions sufficiently precise, you can use a model to answer them.
1.6 Communicate
- Presenting results and writing report
2 tidyverse
-
tidyverseis a collection of R packagesggplot2,tibble,tidyr,readr,purrr,dplyr, and many moretidyverse_packages()\(\rightarrow\) shows the complete list oftidyversepackages
-
tidyversepackages share a common philosophy of data and R programming and are designed to work together naturally- Coding philosophy is different for functions of
tidyversepackages compared to the base R packages
- Coding philosophy is different for functions of
-
Hadley Wickham and his colleagues have been working on
tidyversepackages at RStudio Inc.- Wickham H and Grolemund G (2017). R for data science O’Reilly.
To load all packages of
tidyverse
- No need to load
ggplot2package if you loadtidyversefamily of packages